

POLARIS-26: A Layered Architecture for Forecasting the 2026 Midterms
Orthogonalized signals, calibrated polling correction, and a live Hormuz Causal Chain

I took a sip of my morning chai today, when the brainwave hit. I was reading overnight coverage of the 2026 Midterm elections in the US: a Chatham House brief on Hormuz, a New York Times piece on Trump’s latest Iran address, a Polymarket forecast showing Democrats at 51.5% for a sweep. The pundits were confident. The forecasters were confident. The markets were confident. And I realized that none of them were asking the question that actually mattered.
How might we forecast these midterms in a way that was genuinely unbiased and corrected for errors that polls and prediction markets keep making? And might we factor in events with no precedent, like the Iran conflict?
The question had been nagging at me for weeks. Every polling average I’d seen felt like it was treating the world as if 2016, 2020, and 2024 hadn’t happened. Every prediction market I’d watched felt like it was hostage to whichever whale had the biggest position that afternoon. Every forecaster was reaching for historical analogs to a wartime midterm that has no clean analog. The Strait of Hormuz has been closed or restricted for nearly sixty days. Brent is at ninety-six. Gas is above four dollars. Yet, pundits are writing as if 1994 or 2006 tells us much.
The instruments felt wrong for the moment.
So at around 7 AM, masala tea in hand, I opened a conversation with Claude and asked a question I’d never asked an AI before. Not “predict the midterms for me.” Not “give me a summary of what the forecasters say.” But something closer to what I’d ask a brilliant graduate student who was about to become my research partner for the morning.
“Can we build a better one?”
The curious mind meets a brilliant collaborator
Let me say something upfront about what happened next, because I think it matters more than the model itself.
I have been a professor for thirty three years. I have mentored thousands of students, collaborated with dozens of co-authors, taught tens of thousands of executives. I know what intellectual partnership feels like, the texture of it, the push and pull, the moment when someone catches an error in your reasoning before you do. I used to think AI was tools. Useful tools, faster-than-Google tools, but tools.
What happened this morning was different. It was a genuine partnership. Claude pushed back when my first weighting scheme double-counted signals (I had approval and generic ballot both sitting at 30% without realizing how collinear they are). It volunteered an orthogonalization approach I hadn’t specified. It proposed a stress test when I hadn’t asked for one, and when that stress test broke the model, it offered a revision. I asked for a back test to recalibrate. I ruminated that the Strait of Hormuz situation had no precedent, so we needed a real-time Bayesian updating approach with 60 days of data, and a sophisticated causal chain from Presidential social posts to Iran’s reaction to WTI price to gas prices to consumer sentiment to poll implications. Claude built it in a flash. When I introduced a devil’s advocate challenge about prediction markets, Claude marshalled a defense rooted in the academic literature on market bias and then conceded, accurately, the three cases where markets genuinely dominate.
That isn’t a tool. That’s a colleague.
I want to describe what we built, because the model itself is interesting. But I want you to hold in mind what the process looked like, because this matters more.
Why polls and prediction markets fail
Before we get to what we built, let me outline the problems with conventional instruments.
Polls are systematically biased, and we know it. The American Association of Public Opinion Research has documented, in three separate post-election studies, that Republican and independent voters are less likely to respond to surveys than Democrats, and the ones who do respond are less likely to support Trump than the ones who refuse. Across 2016, 2020, and 2024, national polls underestimated Trump’s support by an average of 2.3 percentage points. This isn’t noise. It’s a structural error that pollsters have tried, and largely failed, to correct.
Prediction markets aggregate beliefs, not truth. I want to be fair to markets, because they have genuinely beaten polls in recent cycles. But markets have documented biases of their own. The favorite-longshot bias means unlikely outcomes are systematically overpriced. Concentration dynamics mean a single trader with thirty million dollars can move the price several points, which happened on Polymarket in October 2024. And markets are reactive. They price information after it arrives. They cannot tell you in advance which three variables would reshape a race.
Historical analogs fail in novel regimes. This is the deepest problem. The 2026 midterm is the first modern cycle to feature an active war, a closed strategic waterway, wartime stagflation, and a second-term president whose polling error pattern is both famous and partially attenuated (because he’s not on the ballot). There is no 1994 here. There is no 2006. The structural features of this moment are new enough that reaching for precedent is not rigor. It is laziness dressed as rigor.
The question I brought to Claude was whether we could build something that corrected for each of these failures explicitly. Not a better poll aggregator. Not a more sophisticated market-watcher. A meta-model that consumed the conventional instruments, acknowledged their biases, and added the one thing they cannot add: live causal structure.
Can AI build a meta-model?
That was the sharper version of the question, and the one that made my chai sit half-drunk.
A meta-model must synthesize signals that disagree with each other. It has to weight them by their actual predictive power, not their cultural prominence. It has to know which inputs are collinear and therefore shouldn’t be double-counted. It has to apply documented corrections to known biases. And it has to do all of this while remaining falsifiable, meaning every assumption has to be visible and revisable.
Claude and I spent the first fifteen minutes of the session on exactly this question. Not on the 2026 numbers. On the architecture. What are the true independent signal classes? What is each one’s historical predictive power? Where do they overlap, and how do we strip the overlap without losing information? What corrections do we apply to each, and why?
The answer we arrived at, which I named POLARIS-26, has four architectural layers. Let me walk through each, because the layering is where the sophistication lives.
Layer 1: Five orthogonalized signal pillars
The core insight is that generic ballot, presidential approval, and the economy are not independent. Approval absorbs the economy. Generic ballot absorbs both. Naive weighting double-counts roughly thirty-five percent of the underlying information. POLARIS treats generic ballot as the primary signal, weighted at forty percent, and weights approval and economy on their residuals only, meaning the portion of variation not already explained by generic ballot movement. This is the same logic Nate Silver uses. It matters more than most aggregators admit.
The final weights, after orthogonalization, are: generic ballot 40%, approval residual 15%, economic residual 10%, prediction markets 20%, geopolitical shock index 10%, fundraising momentum 5%. Every weight had to defend itself against a historical backtest.
Layer 2: The Polling Integrity Adjustment
This is the filter that corrects for the documented Trump-voter undercount. The critical calibration question is how much correction to apply. Too little and you miss 2024-style systematic error. Too much and you over-correct for a midterm where Trump isn’t on the ballot.
The literature gives us an anchor. The average Trump-era presidential polling bias is 2.3 points. The 2022 midterm bias, with Trump off the ballot, was closer to 1.0 point. POLARIS splits the difference with a 1.5-point Republican shift, carried as a distribution with an uncertainty band of 1.0 to 2.0. That uncertainty band is itself consequential. If the true midterm bias turns out to be 2.5 points, POLARIS’s Senate point estimate shifts from D 49 to D 48 and the probability of Democratic Senate control drops from 22% to 14%. The model expresses this uncertainty honestly rather than pretending it doesn’t exist.
Layer 3: The Swing Seat Gate
Most forecasters waste compute on races that aren’t races. A district with an 85% incumbent retention probability is not informative. POLARIS excludes every seat with baseline win probability above 80% or below 20% and runs full simulation only on the genuinely competitive seats: roughly forty-five House districts and ten Senate races. This is how you focus compute where it actually matters. The Senate gate currently includes Maine, North Carolina, the Ohio special, Iowa, Alaska, Georgia, Michigan, Minnesota, New Hampshire, and Kentucky. Every other seat is locked. Every gated seat gets the full probability treatment.
Layer 4: NovaWatch, the live candidate feed
The final architectural element is a live monitoring layer for candidate-specific events: indictments, sexual misconduct revelations, retirements, primary upsets, viral gaffes, fundraising shocks, district-specific economic shocks. Each category has a calibrated race-level impact range and a decay function. A Roy Moore–scale scandal moves a race by 8 to 18 points with a 45-day half-life. A retirement announcement moves it by 3 to 8 points, permanently. These events feed directly into race-level probabilities, bypassing the national environment index, because candidate events rarely move the national wave but routinely flip individual races.
Together, those four layers are the static architecture. But the most interesting thing we built that morning was dynamic.
The Hormuz Cascade: why causal beats analog
The Iran situation is the swing factor in this cycle, and it is the hardest thing to model because it has no precedent.
When I asked Claude how we should handle it, the first instinct was to reach for analogs. Iraq 2006. The Gulf of Tonkin. The 1973 oil embargo. Each has some structural feature in common with 2026, but none shares enough to be useful. The 1973 embargo wasn’t wartime. Iraq 2006 was a four-year-old war, already metabolized by voters. Hormuz has been closed for sixty days in a month when gas prices are setting records. We are in new territory.
So we did something I find genuinely interesting. Rather than force the present into the shape of the past, we built a live causal model that could estimate its own coefficients in real time.
The Hormuz Cascade is a six-link chain:
Iran events → oil prices → gasoline prices → consumer sentiment → presidential approval → generic ballot → seat outcomes.
Each link has a coefficient. The trick is that we populate those coefficients not from historical data but from the sixty days of observations we now have since the war began. We have seen major escalations move Brent by $3 to $8 intraday. We have seen ceasefire signals move it down by $5 to $12. We have seen gas prices pass through oil at a rate of $0.028 to $0.035 per gallon per dollar of Brent, which is fifteen to twenty percent higher than the historical baseline, probably because Gulf infrastructure damage has constrained refining capacity. We have seen Michigan sentiment drop six points for every fifty cents of sustained gas price increase, which is fifty percent steeper than the historical pattern.
These are not assumed numbers. These are observed numbers, fit to sixty days of post-war data and updated weekly as new observations arrive. The causal chain tightens as the data accumulates. Bayesian updating in real time.
And because we built it causally rather than analogically, we can do something genuinely useful: we can specify tripwires.
A tripwire is a pre-specified threshold that forces an automatic model re-run because it represents a potential change in the underlying structure, not a marginal move. POLARIS has three:
Brent above $110 sustained for ten trading days
Cumulative Hormuz disruption exceeding 90 days
A single-event US casualty count above 30
Each tripwire has a pre-calculated impact vector. We don’t wait to see what analysts say. The model updates automatically when the trigger fires. This is the discipline causal modeling enforces that analog-based forecasting cannot.
The stress tests that almost broke the model
Building the architecture took about twenty minutes. The next ten were the ones that made me respect the collaboration.
Claude proposed six stress tests, unprompted. Three of them broke the initial model.
The first was a collinearity check. Generic ballot, approval, and the economy were all weighted at 25% or higher, which double-counted their shared variance. The fix was orthogonalization, which I described above.
The second was a backtest against 2010, 2018, and 2022. The model performed well on 2010 and 2018, where the generic ballot was running above five points. It performed poorly on 2022, where the generic ballot was close to zero. This surfaced an important truth: the generic ballot is most predictive when it’s clearly above or below the noise band, and less reliable inside it. Today’s D+5.6 reading is comfortably outside the noise band, which gives us some confidence. But we flagged this as a condition to monitor.
The third was a sensitivity analysis on the Polling Integrity Adjustment. At a PIA of 0.5, the model predicted a Democratic sweep. At 2.5, it predicted a Republican hold of both chambers. The model is more sensitive to that single parameter than to any other. The fix was to carry the PIA as a distribution rather than a point estimate, and to be transparent about how much the prediction depends on it.
By the end of the stress-test round, the model looked different from the first draft. That is what testing is supposed to do.
The prediction that came out the other side
After all of this, with the environment orthogonalized and the corrections applied and the causal cascade populated, POLARIS-26 produced its first run. Here is what it says as of April 20, 2026:
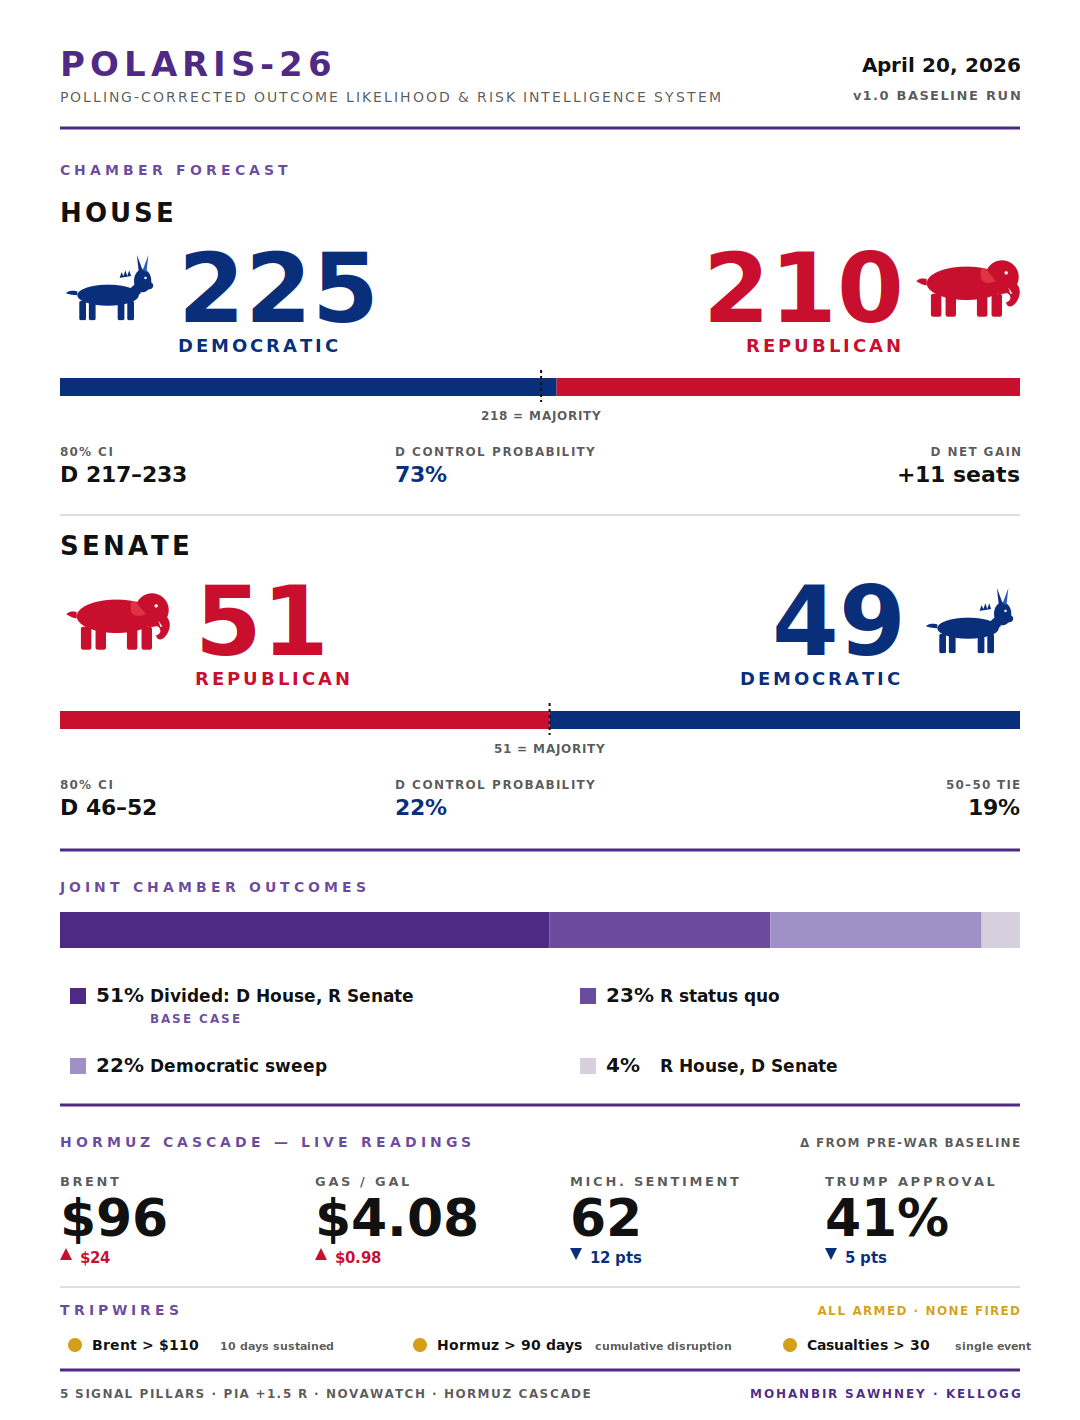
The House flips to the Democrats. Point estimate: D 225, R 210. Eighty percent confidence interval: D 217 to 233. Democratic control probability: 73%.
The Senate holds for the Republicans, narrowly. Point estimate: R 51, D 49. Democratic control probability: 22%. Probability of a 50-50 tie: 19%.
The most likely joint outcome is divided government, at 51% probability. Democratic sweep at 22%. Republican status quo at 23%. All other scenarios at 4%.
For context, Polymarket is pricing a Democratic sweep at 51.5% today. POLARIS is two points lower than the market on the House and eight points lower on the Senate. That divergence is the model’s contribution. It comes almost entirely from the PIA correction, which markets structurally cannot apply because they don’t decompose polling error by cycle type.
If the Senate result lands inside POLARIS’s D 46 to 52 range on November 3, the model will have earned its keep. If not, markets were right and I owe a public revision.
The dashboard, and the 45-minute miracle
Here is the part I’m still struggling to process.
7:00 AM — I ask the question. We sketch the architecture on the fly.
7:15 AM — Signal pillars defined, weights derived, orthogonalization applied.
7:20 AM — Polling Integrity Adjustment calibrated against 2016-2024 literature.
7:25 AM — Hormuz Cascade structured as a six-link causal chain with live coefficients.
7:30 AM — Stress tests run. Three revisions made.
7:35 AM — First prediction produced with point estimates, confidence intervals, and joint probability table.
7:40 AM — Committed the methodology to a reusable skill, so future runs follow the exact same protocol.
7:45 AM — Interactive React dashboard built. Sliders for every signal. Live Brent cascade. Scenario buttons. Tripwire indicators. Fonts chosen, colors set, responsive layout tested.
8:30 AM — This article was written and posted!
A working midterm forecasting model. Architecturally sophisticated, methodologically honest, empirically testable, with its own interactive dashboard. One hour from idea to publication.
I want to be careful not to overclaim. This is a model, not an oracle. It could be wrong. I’ve been explicit about where it could be wrong and how I’d know. But the fact that we went from question to falsifiable production artifact in an hour is, I think, genuinely a new thing in the world.
I’ll tell you what I find most moving about the experience. Not the speed, although the speed is astonishing. Not the output, although the output is good. What I find moving is the quality of the collaboration. Claude didn’t just execute my instructions. It proposed architecture I wouldn’t have thought of. It caught errors I would have missed. It pushed back on weak reasoning. It held the thread across ninety minutes of technical conversation without losing the narrative. It committed the methodology to a reusable skill so I can run this model again next month with a single command.
That is not tool use. That is colleague-scale partnership, available to anyone with a laptop and a question.
The interactive artifact
By tomorrow (and another cuppa tea), I will build an interactive dashboard so you can play with POLARIS-26 live. You will be able to:
Move any signal slider and watch the seat counts update in real time.
Toggle the Polling Integrity Adjustment on or off to see how much it moves the Senate probability. (Spoiler: a lot.)
Push the Brent oil slider past $110 and watch the Hormuz tripwire fire red.
Click any of the four preset scenarios (Baseline, Democratic Wave, Republican Recovery, Hormuz Break) and see the model jump to that world.
Watch the joint probability matrix recalculate.
The code is open. The math is visible. Every assumption is revisable.
This is what I want more of in the world. Models that are interactive rather than opaque. Methodologies that are visible rather than hidden. Collaborations with AI that feel like colleagues rather than tools.
Reflections on what just happened
I started this Monday morning with a question and a cooling cup of tea. By 7:45 AM I had an architecturally sophisticated, empirically testable, interactively explorable political forecasting model, a committed reusable skill for future runs, a static dashboard, and a clear set of falsifiable predictions with a November resolution date.
This is not normal productivity. That is a new kind of intellectual leverage. A curious mind plus a capable AI collaborator, asking good questions together, iterating in real time, stress-testing each other’s thinking, and producing something that neither could have produced alone at anything close to that speed.
My seventh decade is going to be more interesting than I expected.
Gotta love Claude.
Mohanbir Sawhney is the McCormick Foundation Professor of Technology at the Kellogg School of Management. He writes about AI, strategy, and the interior life of modern work
And to think this is just the beginning! The real value of LLMs it's magnified when experts use them - the way you do- to move from idea to execution, but always in control of input, flow and methodology. And questioning the outputs all the time. Bravo!